Google Data Studio: actiegerichte inzichten in een handomdraai
Wie al eens een kijkje heeft genomen in de Google Analytics 360 Suite, is waarschijnlijk Google Data Studio al eens tegengekomen. Maar Data Studio is er ook voor gebruikers van de gratis Google Analytics. Data Studio heeft verschillende functies waarmee je Google Analytics traffic gecombineerd met andere databronnen helder in kaart kunt brengen. Je hebt nu al je dat op één plek, in plaats van data op verschillende platformen.
Koppel verschillende databronnen
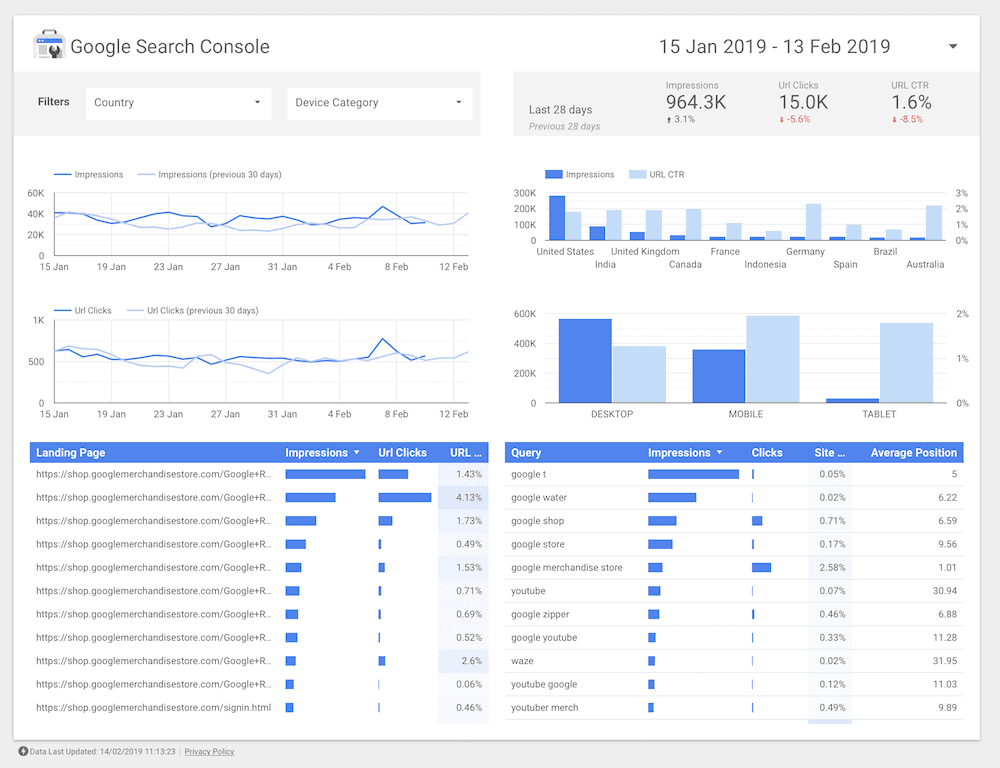
Het handige van Google Data Studio is dat je gegevens uit verschillende bronnen kunt halen. Dit doe je door op ‘Gegevensbronnen’ te klikken en dan op het plusje te klikken. Je hebt dan de keuze uit bijvoorbeeld Google Analytics, Google Ads en Google Search Console.
Data Studio kan ook data halen uit BigQuery en Google Docs. Vooral die laatste is erg interessant: weet jij je data in een Google Sheet te krijgen, dan kun je die met Data Studio combineren en visualiseren. Een gratis dienst zoals Zapier koppelt allerlei diensten weer aan Google Docs, en zo kun je alles koppelen en visualiseren. De data wordt iedere dag automatisch bijgewerkt.
Maak je eigen dashboards
Als je een paar gegevensbronnen hebt gekoppeld, kun je echt beginnen met Google Data Studio. De eerste visualisaties kunnen worden gemaakt. Dit kan op basis van een grafiek of een tabel. Met deze tool kun je instellen welke dimensie je eraan wilt geven.
Google heeft nagedacht over gebruiksgemak en heeft daarom een manier van werken die doet denken aan Excel. Daardoor zou iedereen die wel eens in Excel heeft gewerkt hiermee overweg moeten kunnen.

In Google Data Studio kun je je eigen dashboards maken en delen.
Deel je dashboards
Alle gegevens die je verzamelt, kun je ook delen met andere gebruikers. Dat doe je door rechtsboven in het dashboard dat je wilt delen op ‘Delen’ te klikken. Je kunt dan, net als bij Google Docs of Google Drive, anderen uitnodigen aan de hand van hun e-mailadres. Je kunt ook machtigingen instellen. Zo kunnen sommige gebruikers wijzigingen maken, terwijl anderen alleen de dashboards mogen bekijken.
Daarnaast kun je ook je rapporten op een website insluiten. Bezoekers kunnen zo direct ‘spelen’ met jouw data. Bijvoorbeeld om te laten zien hoeveel bezoekers en sessies je hebt als influencer.
Krijg inzicht door te filteren
In Google Data Studio kun je tabellen en grafieken aanpassen door filters in te stellen. Dat doe je door een tabel of een grafiek te selecteren. Een filter maak je vrij eenvoudig: je klikt op de tabel of grafiek waar een filter voor gemaakt moet worden, en klikt dan op ‘Add filter’ aan de rechterkant van het scherm. Als je een filter hebt gemaakt, druk je op ‘SAVE’.
Als je eenmaal een filter hebt gemaakt, kun je deze ook hergebruiken. Je geeft dan aan waaraan een specifiek onderdeel of een veld moet voldoen. Je kunt ook meerdere velden combineren. Zo maak je een zo uitgebreid mogelijk rapport.
De beperkingen van Google Data Studio
Google Data Studio kent wel een aantal beperkingen. Zo kun je rapportages bijvoorbeeld niet lokaal opslaan. Je kunt ze dus alleen online bekijken en je kunt ze alleen delen. Daardoor ‘verdwijnt’ data ouder dan drie maanden, als de data uit de Search Console afkomstig is. Je moet er dus echt wat mee doen. En als je veel data hebt geïmporteerd, kan het even duren voordat Google Data Studio, en de rapportage geladen is. Het wordt merkbaar traag en het duurt lang voordat de data geladen is. Dit verbetert overigens wel.
Het systeem van de toekomst?
Voorheen was het niet mogelijk om meerdere gegevensbronnen in één grafiek te gebruiken. Per juli 2018 is dit nu wel mogelijk volgens E-Nor destijds (nu overgenomen door Cardinal Path), op veler verzoek. Daarmee laat Google zien snel te reageren op wensen van de gebruikers. Deze tool van online gigant Google zou zomaar het dashboard systeem van de toekomst kunnen zijn. Het is overzichtelijk en gemakkelijk in te stellen. Statistieken worden op een visueel aantrekkelijke manier weergegeven. Ook qua kleuren valt er wat te kiezen: er is zowel een lichte als een donkere variant beschikbaar.
Met Google Data Studio kom je tot veel nieuwe inzichten over jouw website of webshop. Zo kom je er bijvoorbeeld achter waarom het conversievolume vanuit SEO daalt, of welke marketingcommunicatiestrategie echt scoort. Datavisualisatie en dashboarding klinkt in eerste instantie saai. Maar als je daarmee de vinger op de zere plek kunt leggen en je omzet en conversie verhogen? Dan meer data graag!


Reacties